

Dashboard
The main workspace overview — stat cards for projects, agents, running work and tokens, the interactive token usage panel, and recent activity feed.
Dashboard is the home view for an organization. It surfaces high-level counts, a detailed token-usage visualization with filters, and a rolling feed of recent workspace events so you can see the state of your projects, agents, and work at a glance.
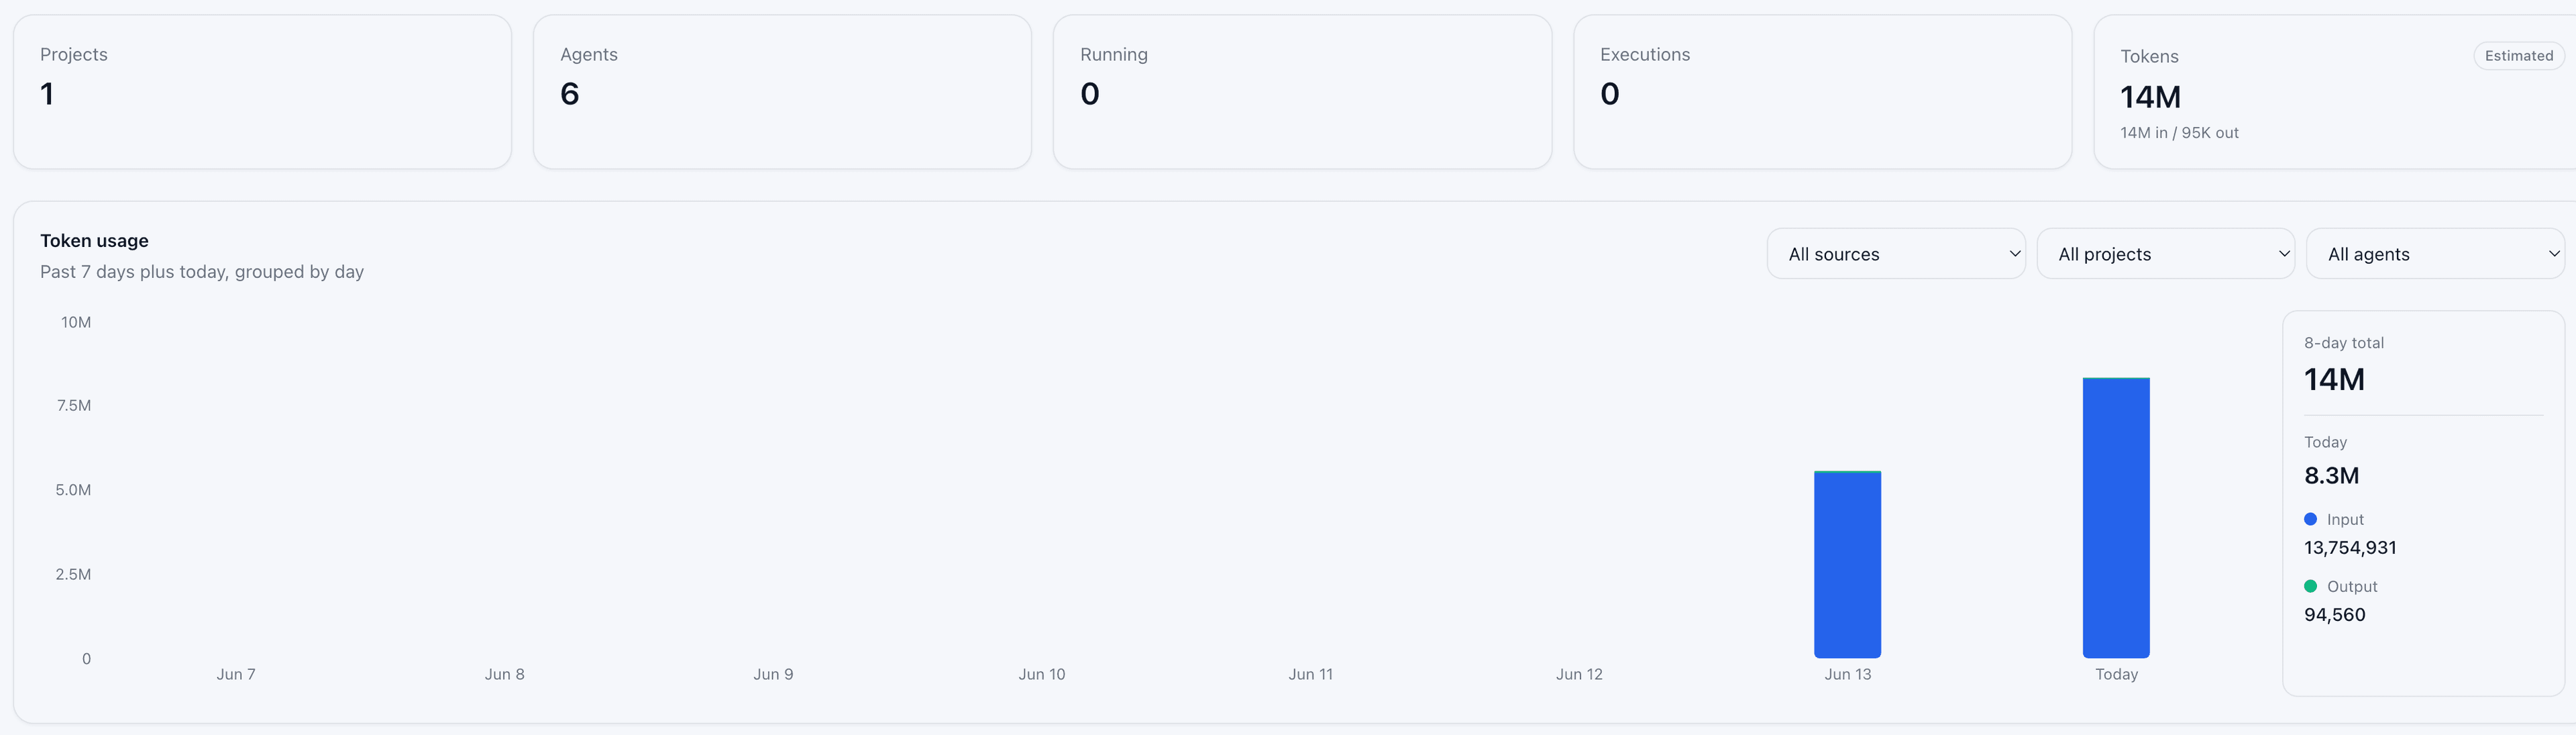
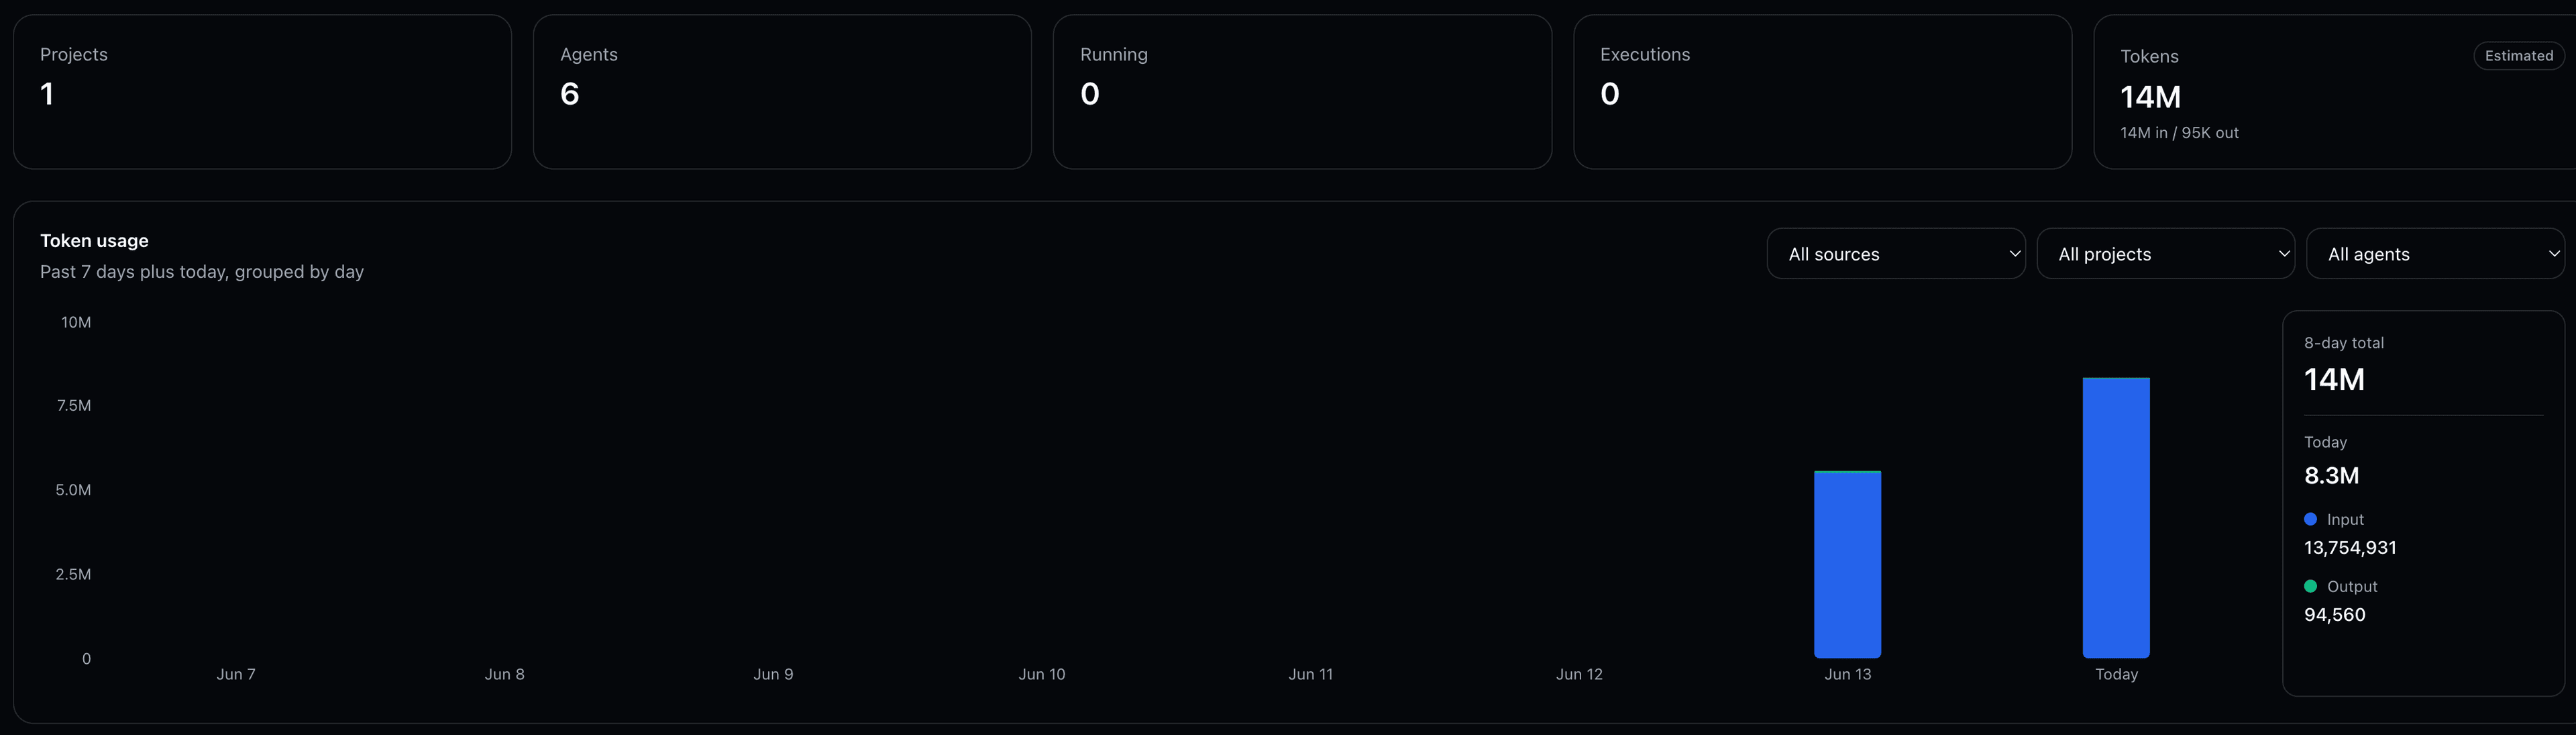
Stat cards
The top of the page displays five clickable summary cards (a responsive grid):
| Card | Value shown | Links to |
|---|---|---|
| Projects | Total number of projects in the organization | /dashboard/projects |
| Agents | Total number of agents | /dashboard/agents |
| Running | Count of recent executions whose status is running or pending | /dashboard/activity |
| Executions | Count of recent executions returned by the platform | /dashboard/activity (desktop) or /dashboard/executions (mobile) |
| Tokens | Compact total tokens (overall for the workspace), marked Estimated. Title/secondary on hover or below show exact input + output split | Jumps to the token usage panel below (#token-usage) |
The counts are fetched live via the catalog and execution/activity endpoints. The Tokens card uses a bare call to the token usage API (no date range or filters) and is labeled "Estimated" because the underlying numbers are server-derived aggregates rather than a live per-run sum.
Token usage panel
The Token usage section renders a detailed, filterable view of consumption.
- Time window: Always the past 7 full days plus today (computed in UTC by
buildSevenDayTokenUsageRangeinlib/tokenUsageRange.ts). The panel requestsgroup_by=day. - Chart: A stacked bar chart (Recharts) with input tokens (blue) below output tokens (green). Bars are daily; the X axis uses short labels ("Today", "Jun 7", etc.). Y axis uses compact formatting.
- Side summary (next to the chart):
- 8-day total (sum across the window)
- Today's usage
- Exact input and output totals for the window (with color swatches)
- Filters (re-query the
/usage/tokensendpoint):- Source: All / Chat / Tasks / Routines / Heartbeats (
TokenUsageSource) - Project (from the org's project list)
- Agent (from the org's agent list, using
display_name || name)
- Source: All / Chat / Tasks / Routines / Heartbeats (
The useTokenUsage hook (and tokenUsageUrl) pass the chosen source, project_id, agent_id, from/to, and group_by to the platform. The response shape is:
{
  input_tokens: number,
  output_tokens: number,
  total_tokens: number,
  breakdown: Array<{ key: string, input_tokens: number, output_tokens: number, total_tokens: number }>
}
For day grouping the key values are the date strings; the UI fills any missing days with zeros and computes the side-panel numbers from the resulting series. The main dashboard card uses the same endpoint without a range to obtain a single overall TokenUsageSummary for the quick "Tokens" stat.
All token data is operational metadata used for observability and cost awareness; protected content inside executions remains encrypted (see Security).
Recent Activity
Below the token panel is a compact "Recent Activity" list (up to 20 entries from the activity feed, refreshed every 10s on the client).
- Each row shows the
summarystring provided by the platform plus a relative timestamp ("just now", "5m ago", "Jun 10", etc.). - Empty state: "No activity yet."
- "View all" link goes to the full Activity page.
The feed aggregates organization-wide events (resource mutations, execution lifecycle, system notifications, etc.) so the whole team can monitor what is happening without opening individual projects or the Activity view.
See Activity for the complete categorized feed and execution traces, Projects and Agents for the resources counted on this page, and Settings (Runtime and Org tabs) for controlling the workers and membership that produce the work shown here.